Quadratic Function
Introduction
A quadratic function is a function in the form of y = ax2 + bx + c, a ≠ 0

So if you observe closely, you will realise that the highest degree is 2 in the function,y = ax2 + bx + c, a ≠ 0 and this is why it is called quadratic function.
Quadratic functions are members of the family of polynomials. Some of the other members from the family of polynomials are as shown in the table below:
| Polynomial Function | Type |
|---|---|
| y = ax + b, a ≠ 0 | Linear Function |
| y = ax2 + bx + c, a ≠ 0 | Quadratic Function |
| y = ax3 + bx2 + cx + d, a ≠ 0 | Cubic Function |
Quadratic functions
The simplest quadratic function is y = x2.
The graph can be plotted by generating several values of y for different values of x as shown in the table below: For example, if we insert value of x equals to -2, the value of y calculated would be 4 as shown in table below. Similarly, we can generate multiple values of y for multiple values of x.
| x | y |
|---|---|
| -2 | 4 |
| -1 | 1 |
| 0 | 0 |
| 1 | 1 |
| 2 | 4 |
Now let us make it a bit more complicated by introducing coefficient "a" and plot the quadratic function y = ax2 , where a = 2
If we plot the graph of y = 2x2 by generating several values of y for different values of x as we plotted earlier for y = x2:
| x | y |
|---|---|
| -2 | 8 |
| -1 | 2 |
| 0 | 0 |
| 1 | 2 |
| 2 | 8 |
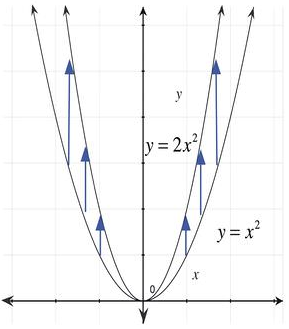
We can clearly observe that graph of y = 2x2 is narrower than y = x2. This is because value of y grows more quickly in case of y = 2x2 as compared to y = x2 for corresponding values of x.
As we increase the value of "a", the value of y would grow more quickly and hence the graph would get more narrower.
| y = | 1 | x2 |
| 2 |
What happens when the value of coefficient "a" is less than 1?
| x | y |
|---|---|
| -2 | 2 |
| -1 | 0.5 |
| 0 | 0 |
| 1 | 0.5 |
| 2 | 2 |
Interestingly, here we observe that graph of
| y = | 1 | x2 |
| 2 |
is wider than y = x2. This is because here value of y grows less quickly as compared to y = x2 for corresponding values of x.
As we decrease the value of "a", the value of y would grow less quickly and hence the graph would get more wider and expands outwards.

So far, we have learnt the behavior of quadratic function y = ax2, where "a" is positive. But what happens when "a" is negative?
| x | y |
|---|---|
| -2 | -4 |
| -1 | -1 |
| 0 | 0 |
| 1 | -1 |
| 2 | -4 |
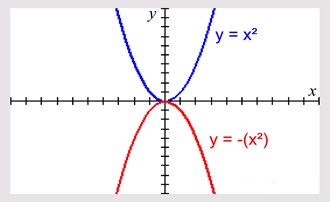
Now if we compare the graph of function y = -x2 with y = x2, we notice that it is mirror image of y = x2 and negative value of coefficient "a" has just flipped the graph upside down!!
This brings us to a very important point to remember - Graph of quadratic function y = ax2 where coefficient "a" is negative is mirror image of graph of quadratic function y = ax2 where coefficient "a" is positive and its shape is concave down.
| To summarise the lessons we have learnt above |
|---|
|
If a < -1 or a > 1, the graph of y = ax2 would be narrower than y = x2 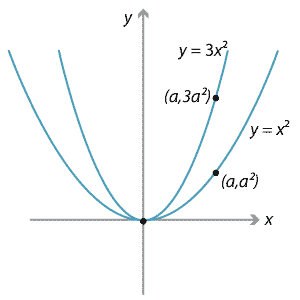
|
|
If -1 < a < 1 where a ≠ 0, the graph of y = ax2 would be wider than y = x2
|
|
Graph of y = ax2 is mirror image of y = -ax2; graph is concave up when coefficient "a" is positive while it is concave down when coefficient "a" is negative
|
The "standard" quadratic function
Extending our learning so far from quadratic function, y = ax2 to standard quadratic function y = ax2 + bx + c
| To summarise the lessons we have learnt above |
|---|
|
In case of a>0, the graph is concave up 
|
|
In case of a<0, the graph is concave down 
|
|
If -1 < a < 1 where a ≠ 0, the graph of y = ax2 + bx + c would be wider than y = x2
|
|
If a < -1 or a > 1, the graph of y = ax2 + bx + c would be narrower than y = x2
TODO
|
Another form of quadratic function
Case 1: Where h>0 and K=0
y = ax2 is most simplified form of y = a(x-h)2 + k, where h = 0 and k = 0
Let us plot y = a(x-h)2, For example, y = a(x-2)2 where h = 2.
| x | y |
|---|---|
| 0 | 4 |
| 1 | 1 |
| 2 | 0 |
| 3 | 1 |
| 4 | 4 |
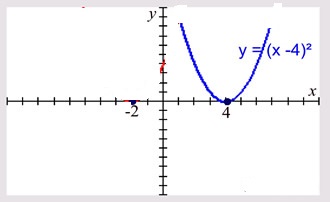
Hence to plot y = a(x-h)2, we just have to shift the graph of y = ax2 by h unit right.
Case 2: Where h<0 and K=0
What happens when h is negative?
For example, y = a(x+2)2 where h = -2
| x | y |
|---|---|
| 0 | 4 |
| -1 | 1 |
| -2 | 0 |
| -3 | 1 |
| -4 | 4 |
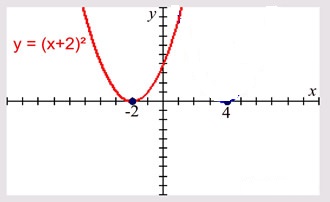
Hence to plot y = a(x+h)2, we just have to shift the graph of y = ax2 by h unit to the left.
| To summarise the lessons we have learnt above |
|---|
|
If h > 0, shift the graph of y = ax2 by h units to the right to achieve the graph of y = a(x-h)2 |
|
If h < 0, shift the graph of y = ax2 by h units to the left to achieve the graph of y = a(x-h)2 |
Case 3: k > 0
So far, we have learnt how to plot y = a(x-h)2 from y = ax2. Now let’s plot y = a(x-h)2 + k, where k > 0
For example, y = a(x-2)2 + 4
| x | y |
|---|---|
| 0 | 8 |
| 1 | 5 |
| 2 | 4 |
| 3 | 5 |
| 4 | 8 |
You can clearly notice that each value of y in case of y = a(x-2)2 + 4 is higher by unit of 4 as compared to y = a(x-2)2
Case 3: k < 0
What happens when k is negative?
For example, y = a(x-2)2 - 4, here k = -4
| x | y |
|---|---|
| 0 | 0 |
| 1 | -3 |
| 2 | -4 |
| 3 | -3 |
| 4 | 0 |
You can clearly notice that each value of y in case of y = a(x-2)2 - 4 is lower by unit of 4 as compared to y = a(x-2)2
| To summarise the lessons we have learnt above |
|---|
|
If k >0, shift the graph of y = a(x-h)2 up by k units to achieve the graph of y = a(x-h)2 + k |
|
If k >0, shift the graph of y = a(x-h)2 down by k units to achieve the graph of y = a(x-h)2 + k |
| Thus to plot any quadratic function y = a(x-h)2 + k from y = ax2 |
|---|
|
If h > 0 and k > 0, shift the graph of y = ax2 by h units to the right and up by k units.
TODO
|
|
If h > 0 and k < 0, shift the graph of y = ax2 by h units to the right and down by k units.
TODO
|
|
If h < 0 and k > 0, shift the graph of y = ax2 by h units to the left and up by k units.
TODO
|
|
If h < 0 and k < 0, shift the graph of y = ax2 by h units to the left and down by k units.
TODO
|
The graph of a quadratic function
The graph of quadratic function y = ax2 + bx + c is called parabola.
Let us briefly discuss about parabola. A parabola is a type of conic section. A conic section, as the name suggests is a section obtained by slicing of a cone
| Depending upon the way we slice the cone, there are four conic sections |
|---|
|
Parabola : when the cone is cut parallel to its slant slide. 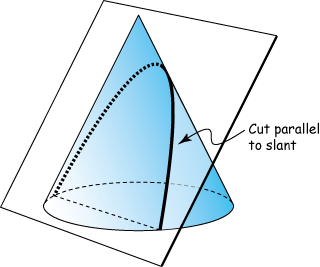
|
|
Hyperbola : when the both top and bottom part of cone is cut by a plane. 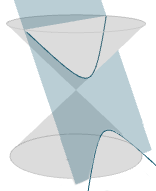
|
|
Ellipse : when the cone is cut by a plane at a slide angle. 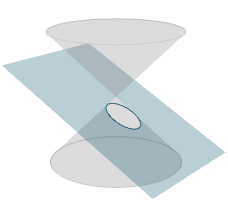
|
|
Circle : when the cone is cut parallel to its axis. 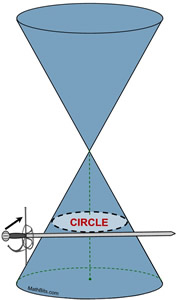
|
|
Summary : 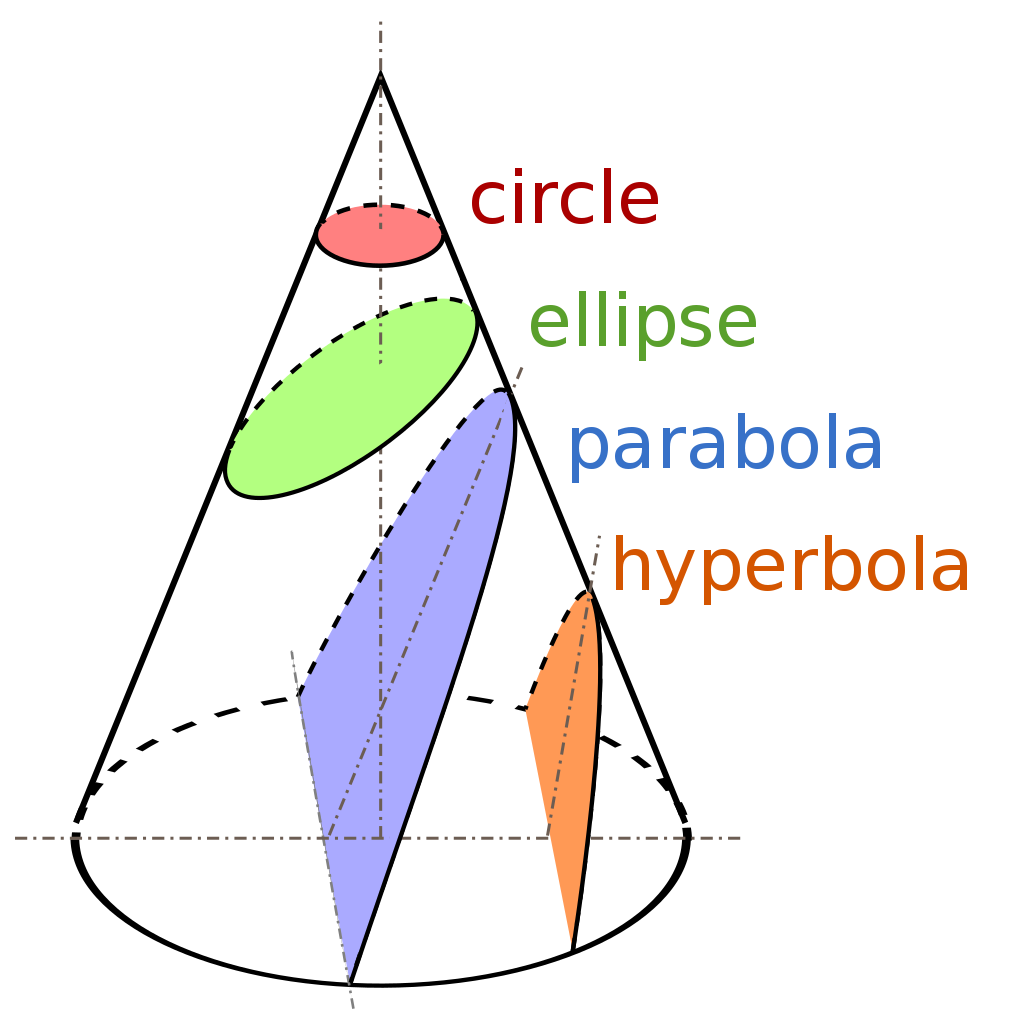
|
Characteristics of graph of a quadratic function
Every graph of quadratic function y = ax2 + bx + c shares these following characteristics:
Vertex- It is the point where the graph turns and changes direction. Hence it is the extreme point on the graph. By extreme point we mean:
Axis of symmetry- It is the vertical line that passes through vertex and divides the graph into mirror images. Hence, the equation of axis of symmetry would be vertical line x = h, where h is x coordinate of vertex
y-coordinate- It is the point where the graph crosses the y axis
x-coordinate- It is the point/ points where the graph crosses the x axis
How to calculate vertex and axis of symmetry of quadratic function
We have learnt to plot y = a(x-h)2 + k
We can easily notice that h and k gives us the highest or lowest point of the graph. As we know that vertex is the highest or lowest point of the graph (where the graph turns), hence the coordinate of vertex is (h,k)
Hence, y = a(x-h)2 + k is also known as vertex form of a quadratic function
If we compare vertex form of a quadratic function with standard form of quadratic equation y = ax2 + bx + c,
y = a(x-h)2 + k
y = a(x2 - 2hx + h2)+ k
y = ax2 - 2ahx + ah2+ k
y = ax2 + (-2ahx) + (ah2+ k)
Comparing it with standard form of quadratic equation y = ax2 + bx + c
Hence, b= -2ah; solving for h, we get h = -b/2a
and c= ah2 + k
When we replace x = h in standard form y = ax2 + bx + c, we will get the y coordinate of vertex
We know that axis of symmetry is the vertical line that passes through vertex and the equation of axis of symmetry is the vertical line x = h, where h is x coordinate of vertex
Hence the equation of axis of symmetry would be x= h or x = -b/2a
For example, let’s find vertex and axis of symmetry of quadratic function y = 3x2 + 6x + 1
Comparing it with standard form y = ax2 + bx + c
We get a = 3, b = 6 and c =1
Now the coordinate of vertex would be (h,k)
h = -b/2a = (-6)/2(3) = -1
and y coordinate of vertex, k = ah2 + bh + c = ((3)(-1)2 + (6)(-1) + 1= -2
Hence the vertex is (-1,-2)
and equation of axis of symmetry would be x= h ie. x= -1